Table of Contents
Most oil and gas inefficiencies don’t announce themselves. There’s no alarm for “someone spends four hours a week reformatting a spreadsheet.” These tasks just become part of the job — accepted, absorbed, never questioned.
Add them up across a team, a quarter, a year, and they represent a real cost — not just time, but the strategic work that time could have gone toward instead.
Here are five tasks we see again and again in oil & gas and manufacturing operations — the kind that quietly eat a workweek without ever looking like “a problem.”
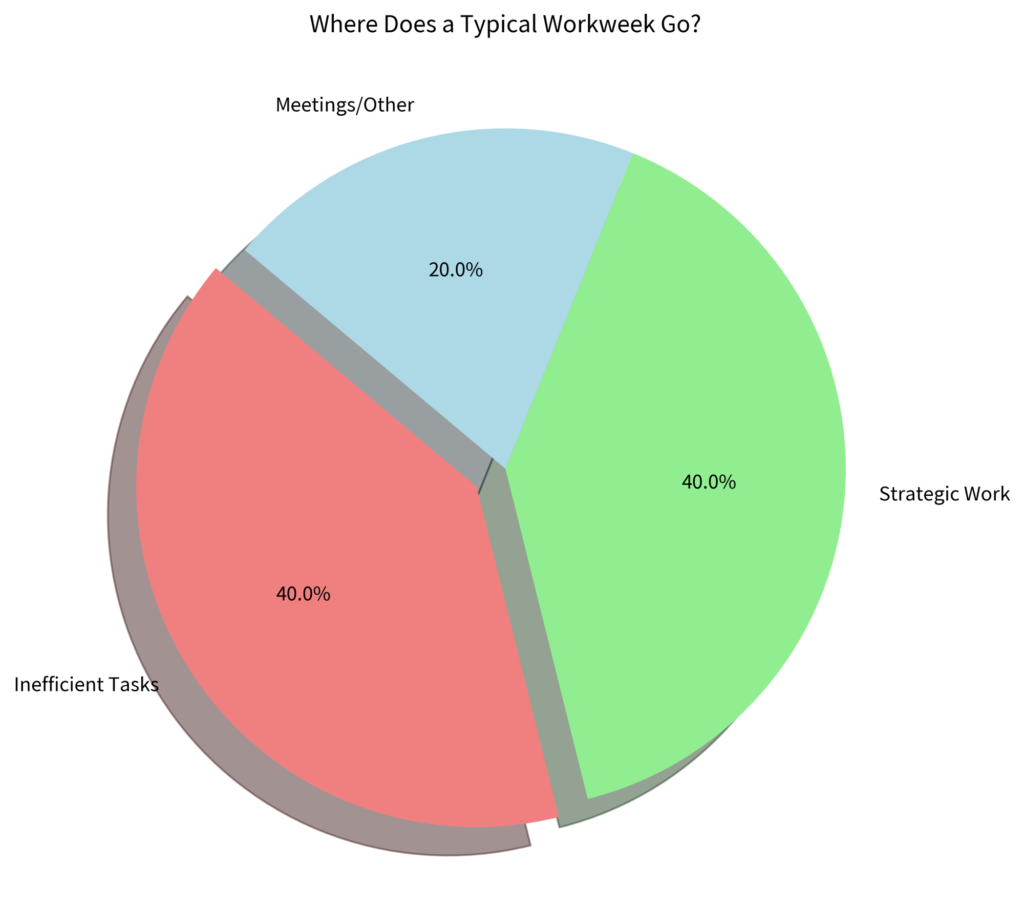
Where Does a Typical Workweek Go?
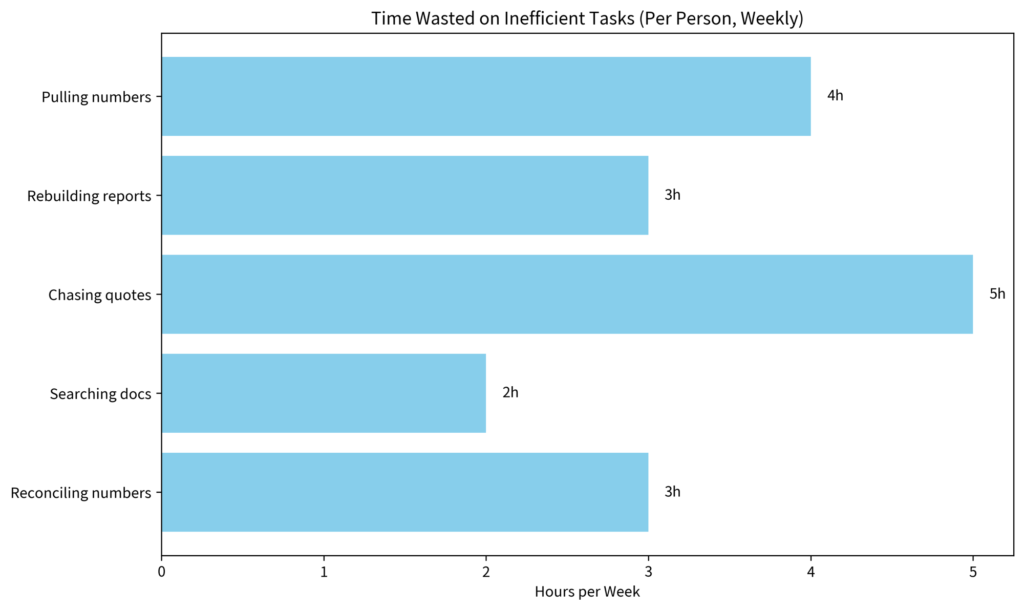
Time Wasted on Inefficient Tasks (Per Person, Weekly)
1. Pulling numbers from systems that don’t talk to each other
Production data lives in one system. Financials in another. Maintenance logs in a third. Someone becomes the human API — exporting, reformatting, and stitching it together before anyone can act on it.
The cost: hours per week, and a delay between “the data exists” and “someone can use it.”
2. Rebuilding the same report from scratch, every week
Executive dashboards, shift reports, compliance summaries — many teams recreate these on a recurring schedule, even though the structure never changes.
The cost: repetitive effort that adds no new thinking each time it’s done.
3. Chasing quote details across departments
Sales gets a request, then loops in ops for pricing, engineering for feasibility, and finance for terms — often across email threads that stretch for days.
The cost: slower turnaround, and sometimes a lost deal to whoever answered faster.
4. Searching for the one document that answers a question
A contract clause. A renewal date. A compliance record. Everyone knows it exists — “somewhere” can mean an hour digging through drives and old email folders.
The cost: interruptions, delays, and occasionally a missed deadline hiding in a file nobody found in time.
5. Reconciling numbers that should already match
When two systems both claim to have “the truth,” someone has to manually check which one is right — and why they disagree.
The cost: time spent double-checking instead of deciding.
The pattern behind all Five oil and gas inefficiencies
None of these are broken processes. They’re processes nobody’s had the bandwidth to rethink — which is usually where the opportunity is. Not a sweeping overhaul. A focused fix to the task your team already dreads.
How We Solved Oil and Gas Inefficiencies at Crestwood: Before vs After
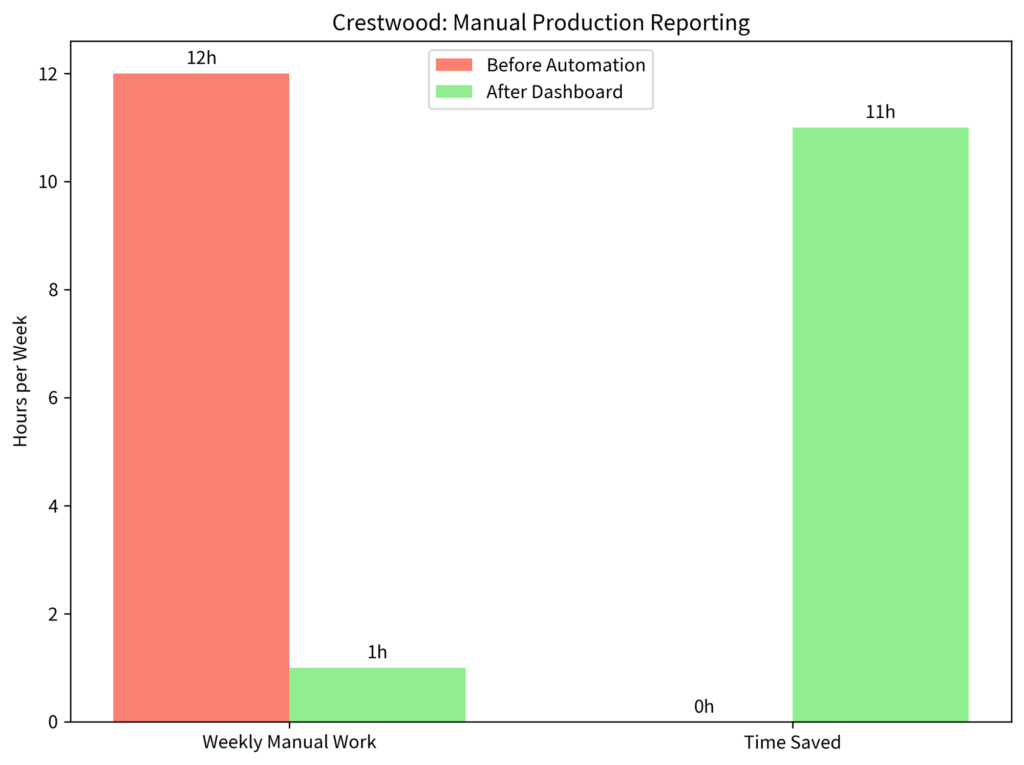
We saw this firsthand with Crestwood, a midstream oil & gas operator whose team was pulling production numbers by hand across scattered systems every week. In under 8 weeks, we replaced that routine with a single executive dashboard — no more manual queries, no more stitching reports together.
Which of these oil and gas inefficiencies hits closest to home for your team?
If one of these five sounds like a Tuesday on your team, that’s usually a sign it’s worth a second look — not a six-month project, just a focused look at what’s actually eating the time.
Frequently Asked Questions About Oil and Gas Inefficiencies
What are the most common oil and gas inefficiencies in day-to-day operations?
The costliest ones are rarely dramatic. Manually pulling production data from systems that don’t integrate, rebuilding the same weekly report from scratch, chasing quote details across departments, hunting for a single contract or compliance document, and reconciling numbers between two systems that should already agree. Individually each looks like “just part of the job.” Together they consume a meaningful share of a workweek per person.
How much time do these inefficiencies actually cost?
For most teams we assess, manual reporting alone consumes 60–80% of an analyst’s time. One finance team we worked with was spending 20+ hours a week on Excel compilation before automation cut it to four.
Do we need to replace our existing systems to fix this?
Usually not. Most oil and gas inefficiencies come from data that lives in separate systems with no connective layer — not from bad systems. A properly built reporting layer pulls from your existing ERP, SCADA, historian, and financial platforms without replacing any of them.
How long does it take to fix one of these?
Narrowly scoped, faster than most people expect. Crestwood’s executive dashboard replaced their manual query process in under eight weeks. A proof of concept on your real data can be ready in about 10 days.
Where should we start if several of these sound familiar?
Pick the one your team complains about most. A single automated report or dashboard usually surfaces the next bottleneck on its own — which beats scoping a six-month transformation program before you’ve proven anything works.
Ready to Fix the Oil and Gas Inefficiencies Eating Your Week?
CDO Advisors builds Power BI dashboards for midstream operators, producers, and service companies that are tired of stitching reports together by hand. Working dashboards in four weeks. $150/hr flat, no markup. Pause billing anytime.