3 Business Views in Power BI
I often see reports that were built in Power BI only designed for 1 audience in mind. A typical reporting project involves putting in a request to the BI team to get a new report. Then you meet and provide requirements for the report and views for your report. While designing the report other business views will most likely be needed. Yet they are often an after thought and require additional time and work. A best practice that I have developed involves thinking about the 3 business views in Power BI that business users will need.
Rarely does someone just ask for a report that only they will use. Managers will want an aggregated or trend report. Everyone should be looking for data quality issues to make the data better and more accurate.
Improve your reports and report requirements session by considering these three business views in Power BI reports for each report request. First the business view that need to use to run their business. Second what view or views will their management team want. Third what types of exceptions should be reported and how.
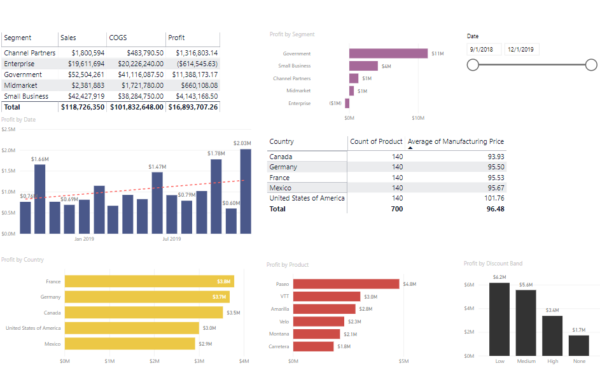
1 - Operations Views to Run Your Area
What do you need in this report to run your business and make data driven decisions? What source data is being displayed, business logic that is applied, etc. 95% of reports focus on this aspect when being requested and developed. Take advantage of the BI resources when you have them working on your projects to get not only the views that you need. But take the extra time to build out the other views.
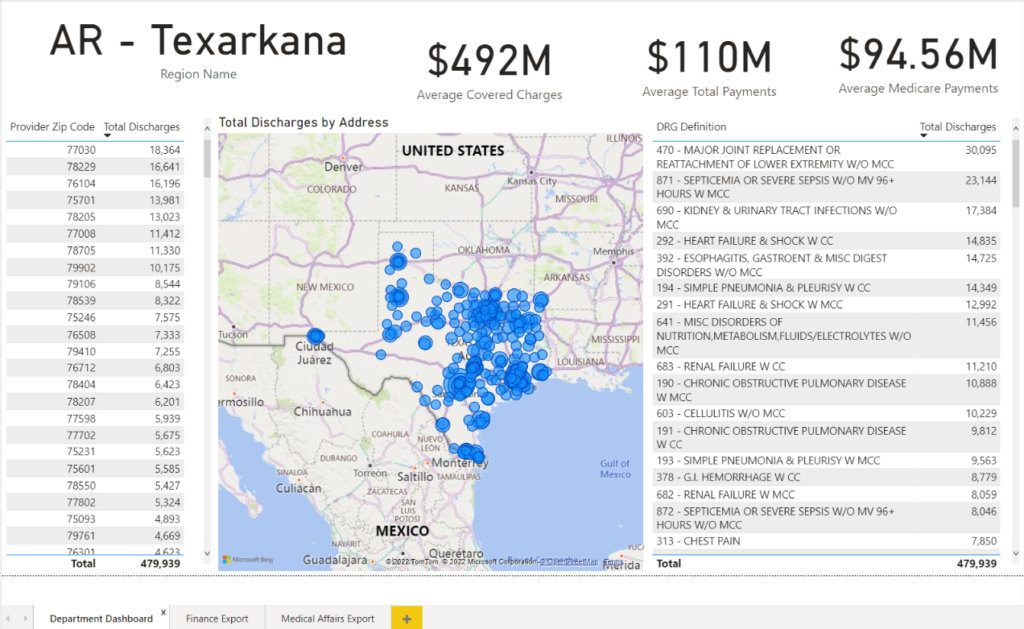
2 - Management View to Share Outside Your Area
The next area to think about with every report request is who else in the organization may want a view of the data. Do you need to create views or tables that highlight summary data that management teams or other departments would need to help them make better decisions? If so, create some views designed and labeled for customers outside your department.
How will these users get the reports? Will you email them the pages via a subscription? Do they want the data in email and only want a screenshot? Do you need to provide an easy way to export the data and send them an file?
Your users are unique and how they want the data varies between them. Design external business views in Power BI that make it easy for you to share your data with external teams.
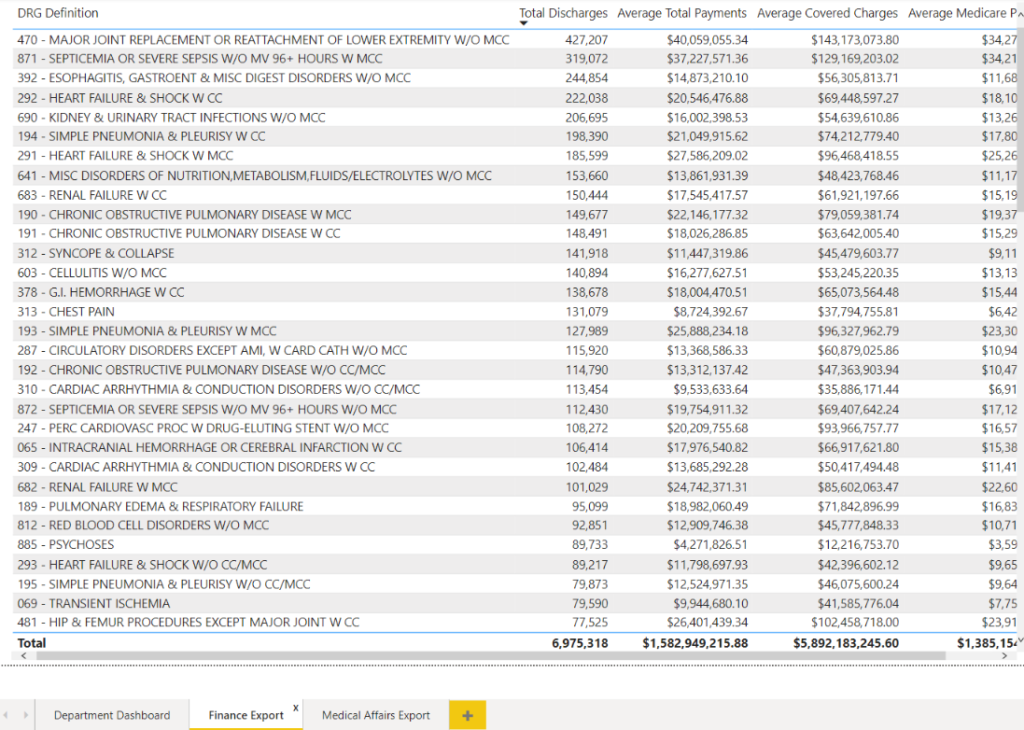
3 - Exception Views for Data Quality
Data quality is a constant battle in every organization. One way to make data quality a primary goal is to build exception reports into each report that help users find data that is suspect. Once users can easily identify data quality issues users are more likely to update the source system to correct the data.
Add at least 1 page focused on exceptions. Ideas include minimum and maximum dates. Do you have dates that are years in the future that should not be? Business rules to check for conditions in your data. One example could be closed sales status with a stage that is awaiting client feedback.
The specific rules that you build should be related to the report or the dataset used in the report for users that have the ability to change the data in the source systems.
Looking for help to create business views in Power BI? Fill out the contact form for a free consultation.
CDO Advisors Microsoft Power BI Solutions:
Get Power BI Consulting – CDO Advisors Increase Power BI Adoption
Increase Power BI Adoption – See how we help you get more from your investment
Power BI Consulting as a Service – Low Monthly Fees, Pay Per Month Per User
Microsoft Power BI Demo – Compare your current reporting to Power BI
Power BI Quick Start Solutions – Ready to start or enhance your Power BI?
Microsoft Power BI Consulting – Learn more about our Consultants
Use Power BI to Transform Your Data – Transform your business with Data