5 Ways Dashboards Improve ROI for Small Businesses

Small business owners need actionable data and analytics just like Fortune 500 companies.  The difference is many SMBs do not have full time staff dedicated to reporting or analytics.  They cannot afford to hire full time staff or typical contract engagements take to long and cost too much.

Humans can interpret data visualizations faster than data grids like a typical Excel spreadsheet.  You can however get started with data visualization by using your existing Excel reports as the data source to create automated online dashboards and KPIs.

  1. Save Time
  2. Make Better Decisions
  3. Spot Trends, Patterns or Outliers in Your Operations
  4. Focus on What Really Matters
  5. Improve Decision Making at all Organization Levels

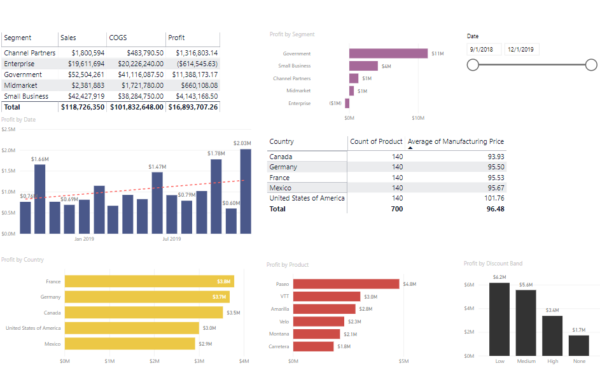
Save Time – Dashboards Improve ROI

Dashboards with clear data visualizations enable you to make faster decisions.  Visualizations enhance the data and transform it into information that can be more easily understood. 

In addition, dashboards improve ROI by eliminating the need of having your employees pulling data and then merging it or linking across several Excel files.  Automation of the data allows for the dashboards to be updated frequently based on the source files or databases.  Have your team spend more time analyzing data and less time trying to find the same data, day after day.  

Dashboards Improve ROI - Save Time
Executive Dashboard Sample

Make Better Decisions

Use of dashboards improve ROI by allowing you to make better decisions.  Visually being able to see the entire picture of a process or relationships between data lead to better decisions and outcomes for your business.  Simplify your data, visualize your information and make better decisions.

Features of Dashboards to Make Better Decisions

  • Interactive Filters
  • Access from Anywhere
  • Single Portal for everyone to access the same data
  • Easy to understand data visualizations
  • Drill through analytics
  • Alerts

Spot Trends, Patterns or Outliers in Your Operations

There is no better way to know what is happening in your business than with data visualization on a dashboard that show you what is really happening in your business.

Leverage historical data to create trend analysis to see you critical metrics over time and dynamically filter or drill into the data to find out what is driving those trends.

Often new patterns emerge from your data that are another example of how dashboards improve ROI.  Being able to see relationships that are not possible from a data grid can improve your operations, increase revenue or decrease expenses.

Sometimes you may not even realize what is really going on outside your normal operations.  Outlier analysis is very easy to spot when presented on a dashboard.   No need filter your dataset from largest to smallest or try to combine data elements to figure out what’s happening.  


Focus on What Really Matters

Every business collects more and more data than they can possible use in normal operations.  Dashboards improve ROI by focusing on your critical metrics and KPIs.  Get your team engaged and ensure they are looking at the data you want them to focus on.  By presenting this data in an easy to use data visualization and dashboard you and your team are all looking at the same metrics. 


Improve Decision Making at all Organization Levels

Employees of all levels in an organization can more easily understand data visualizations over complex spreadsheets.  If you want to have more people make better and faster decisions then implementing dashboards is very valuable.  Dashboards improve ROI by making data accessible to everyone.  


Power BI Consulting as a Service

Get help with Power BI Consulting

CDO Advisors Microsoft Power BI Solutions:

Get Power BI Consulting – CDO Advisors Power BI Consulting

Power BI Consulting as a Service – Low Monthly Fees, Pay Per Month Per User

Request a Power BI Consulting POC – No Risk Obligation to see your data better

Executive Dashboards – Get Dashboards in 4 Weeks

Microsoft Power BI Demo – Compare your current reporting to Power BI

Power BI Quick Start Solutions – Ready to start or enhance your Power BI?

Microsoft Power BI Consulting – Learn more about our Consultants

Use Power BI to Transform Your Data – Transform your business with Data

Power BI Consulting as a Service
Dashboards Improve ROI - Focus on Key Metrics