[fusion_builder_container hundred_percent=”no” hundred_percent_height=”no” hundred_percent_height_scroll=”no” hundred_percent_height_center_content=”yes” equal_height_columns=”no” menu_anchor=”” hide_on_mobile=”small-visibility,medium-visibility,large-visibility” status=”published” publish_date=”” class=”” id=”” background_color=”” background_image=”” background_position=”center center” background_repeat=”no-repeat” fade=”no” background_parallax=”none” enable_mobile=”no” parallax_speed=”0.3″ video_mp4=”” video_webm=”” video_ogv=”” video_url=”” video_aspect_ratio=”16:9″ video_loop=”yes” video_mute=”yes” video_preview_image=”” border_size=”” border_color=”” border_style=”solid” margin_top=”” margin_bottom=”” padding_top=”” padding_right=”” padding_bottom=”” padding_left=””][fusion_builder_row][fusion_builder_column type=”2_3″ layout=”2_3″ spacing=”” center_content=”no” link=”” target=”_self” min_height=”” hide_on_mobile=”small-visibility,medium-visibility,large-visibility” class=”” id=”” background_color=”” background_image=”” background_image_id=”” background_position=”left top” background_repeat=”no-repeat” hover_type=”none” border_size=”0″ border_color=”” border_style=”solid” border_position=”all” padding_top=”” padding_right=”” padding_bottom=”” padding_left=”” margin_top=”” margin_bottom=”” animation_type=”” animation_direction=”left” animation_speed=”0.3″ animation_offset=”” last=”no”][fusion_text columns=”” column_min_width=”” column_spacing=”” rule_style=”default” rule_size=”” rule_color=”” hide_on_mobile=”small-visibility,medium-visibility,large-visibility” class=”” id=””]
Power BI What If Example Using Sales Data
If you have not tried to use the Power BI What If feature, this blog post is for you. Change how your users perform analytics with simple sliders that let them change the values in their reports to see potential impacts of decisions. By adding in the What If parameter you enable your analysts, managers or anyone else the ability to not just look at the data but to truly do more with their data. Common use cases are forecast vs actual, sales quota changes, sales unit changes, call center volume changes, health care claim forecasts. Once you see what you can do with this feature, I’m certain you will find applications for it in your organization.
Power BI What If Step by Step
In this example, I am going to show you how to use 2 What If parameters in the same Power BI Desktop report. As a sales manager, I want to be able to increase my sales forecasts from 0-10% as well as see the impact on only a single region. You can download the file here Sales Example File
Step 1 – Power BI Desktop What If Parameter
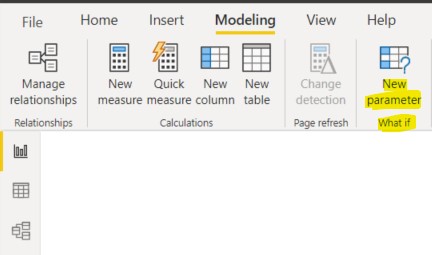
Open Power BI Desktop and click on the Modeling tab in the ribbon, then select the New Parameter (highlighted in yellow)

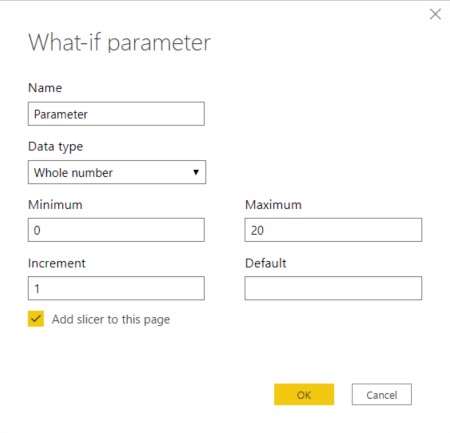
The What If Parameter window is displayed for you to enter your values. Note, you have to use numerical values in Power BI What If scenarios.

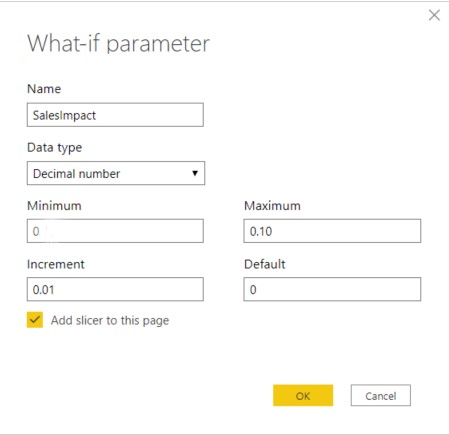
Now to create values from 0-10% fill out the What If Parameter with the following values:

Format the SalesImpact field as a percentage and then you will see a slider bar with the values 0% to 10%:

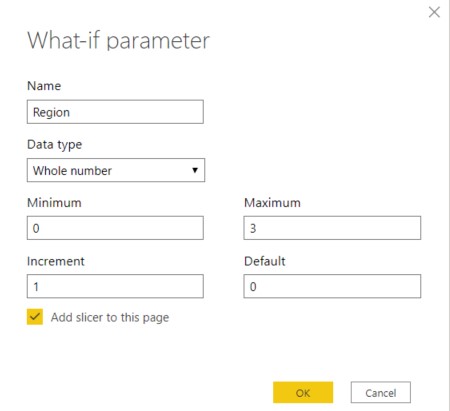
Now create another What If Parameter following the same process name Region with values from 0-3, as shown below:

What if Region Values
Step 2 – Building the Power BI What If Report
Now we want to add new measures to leverage the sliders that were just built.
First add a Measure named SalesImpact with the following DAX.

[/fusion_text][fusion_text columns=”” column_min_width=”” column_spacing=”” rule_style=”default” rule_size=”” rule_color=”” hide_on_mobile=”small-visibility,medium-visibility,large-visibility” class=”” id=””]
Most businesses lack the time and expertise to build dashboards that get results. At CDO Advisors, we’ll build you an amazing analytics dashboard at an affordable price. So you can quickly make data driven decisions, spot issues and improve your business.
[/fusion_text][/fusion_builder_column][fusion_builder_column type=”1_3″ layout=”1_3″ spacing=”” center_content=”no” link=”” target=”_self” min_height=”” hide_on_mobile=”small-visibility,medium-visibility,large-visibility” class=”” id=”” background_color=”” background_image=”” background_image_id=”” background_position=”left top” background_repeat=”no-repeat” hover_type=”none” border_size=”0″ border_color=”” border_style=”solid” border_position=”all” padding_top=”” padding_right=”” padding_bottom=”” padding_left=”” margin_top=”” margin_bottom=”” animation_type=”” animation_direction=”left” animation_speed=”0.3″ animation_offset=”” last=”no”][fusion_youtube id=”https://youtu.be/SEY9HV2jR80″ alignment=”center” width=”” height=”” autoplay=”false” api_params=”” hide_on_mobile=”small-visibility,medium-visibility,large-visibility” class=”” css_id=”” /][fusion_code]PGRpdiBjbGFzcz0iX2Zvcm1fMTEiPjwvZGl2PjxzY3JpcHQgc3JjPSJodHRwczovL2Nkb2Fkdmlzb3JzLmFjdGl2ZWhvc3RlZC5jb20vZi9lbWJlZC5waHA/aWQ9MTEiIHR5cGU9InRleHQvamF2YXNjcmlwdCIgY2hhcnNldD0idXRmLTgiPjwvc2NyaXB0Pg==[/fusion_code][fusion_separator style_type=”single solid” hide_on_mobile=”small-visibility,medium-visibility,large-visibility” class=”” id=”” sep_color=”” top_margin=”15px” bottom_margin=”” border_size=”” icon=”” icon_circle=”” icon_circle_color=”” width=”” alignment=”center” /][fusion_text columns=”” column_min_width=”” column_spacing=”” rule_style=”default” rule_size=”” rule_color=”” hide_on_mobile=”small-visibility,medium-visibility,large-visibility” class=”” id=””]
CDO Advisors Microsoft Power BI Solutions:
BI as a Service – Low Monthly Fees, Pay Per Month Per User
Executive Dashboards – Get Dashboards in 4 Weeks
Healthcare Dashboard Proof of Concept – SEE your data visualized
Microsoft Power BI Demo – Compare your current reporting to Power BI
Power BI Quick Start Solutions – Ready to start or enhance your Power BI?
Train Your Team – Remote Power BI Developer and End User Training
Use Power BI for Finance Teams – Learn how Power BI can improve operations
Virtual Chief Data Officer – Confused by all your data? We can help
CDO Advisors YouTube – Subscribe and Watch Our YouTube Channel
[/fusion_text][/fusion_builder_column][/fusion_builder_row][/fusion_builder_container]
