What are Business Dashboards?
Just like your car, a business dashboard collects in one location all of the critical information you need to run your business. A management or executive dashboard should be easily accessible and like an automotive dashboard organizes and visually displays your data from various sources in one location. They are critical for business intelligence solutions and enable self-service analytics for your employees. If your employees do not know how you are performing against KPIs they are unable to make the best decision to improve performance.
Why You Need Business Dashboards?
Dashboards differ from traditional reporting in many ways. First they are designed to visually see lots of data in a single location. Management dashboards mash up data from your various sources to make it easy to for you to monitor your business. Easily merge KPIs from you various departments into a single organization view. No longer do your management team need to spend time putting together PowerPoints or send files or updates so you know how business units are performing. Get instant secured access to your business drivers, see your data via the cloud or mobile app. No VPN required. Hold your team accountable, monitor your data and improve your business.
We build our business dashboards on Microsoft Power BI, a leader in the industry for BI, data visualization and analytics.
Elements of a Business Dashboard
Dashboards allow you to mashup data from internal or external sources to a single location. They are designed to show the best available information required to make decisions. Easily spot trends, patterns and outliers in your data.
Data Sources
Business dashboards start with data. You can connect one or many data sources into your dashboard. Common data sources include files such as Excel, csv, databases or online APIs.
Visualizations
Rather than look at data as just columns and rows. Dashboards enable you to view your data visually which makes it easier for you to determine what is really going on in your business. Our brains are wired to process images and patterns faster than a data grid. Choosing the right visual is critical and depends upon your end results.
Filters
Self-service BI dashboards enable your team to find the data they need without extra coding or re-work. Filtering occurs in 2 ways, you can filter the information on the page in the dashboard. Or you can filter by clicking on the visualizations and then the other visualizations will change. For example, if you have sales dashboard. Clicking on a product, would filter all of the other visuals to show only metrics for that product.
Microsoft Power BI enables all of these features and is the most cost effective solution for your business.
Read more about business dashboards in our next blog post – 3 Types of Dashboards
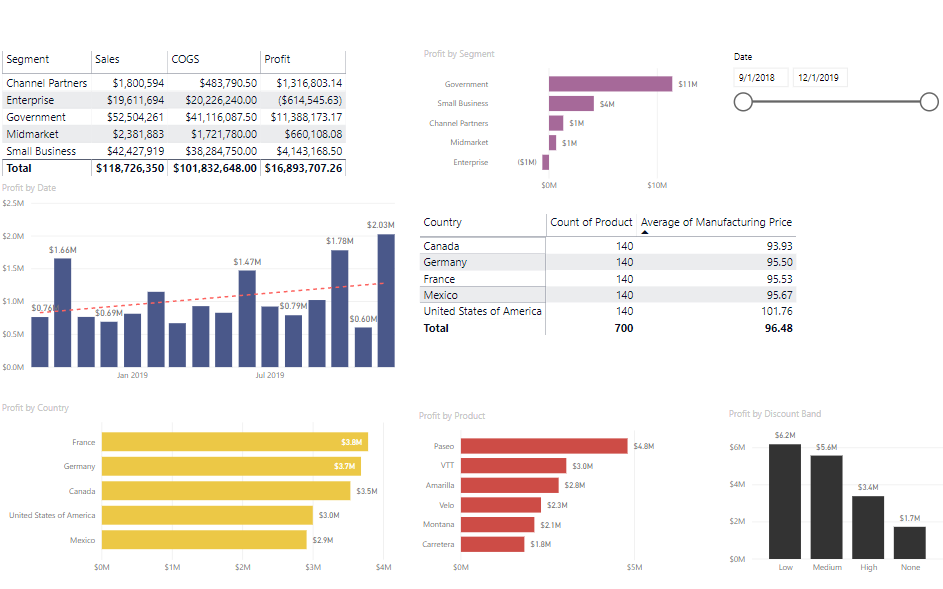
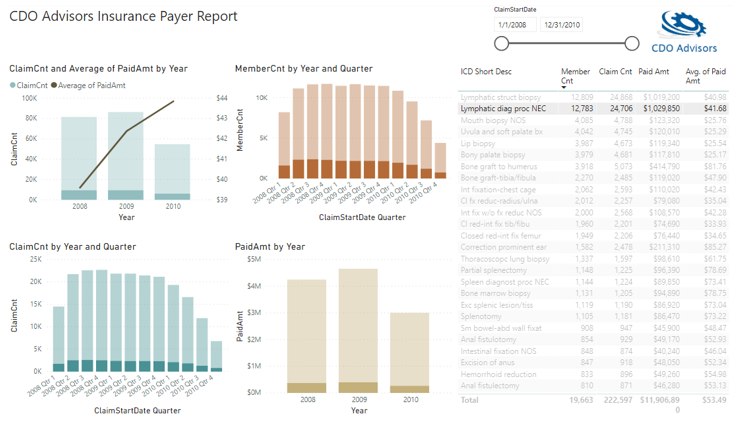
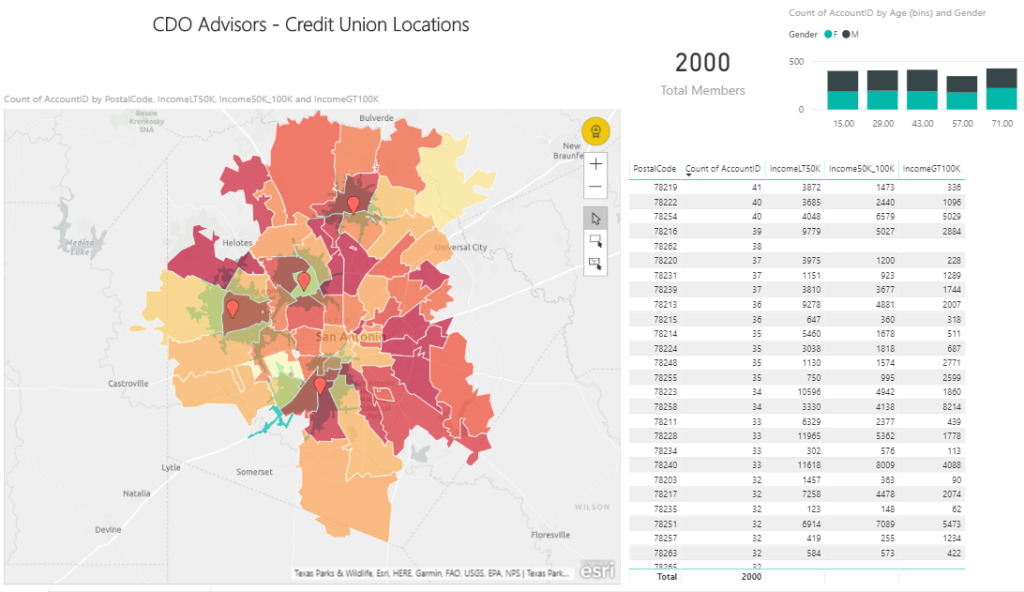
Dashboard Examples


Get Dashboards & Transform Your Business
At CDO Advisors we know you are the kind of people who want to allow your team to make business decisions based on clear data insights. In order to be that way, you need online dashboards that enable data drive decisions. The problem is your team doesn’t have the time and expertise to quickly build analytic dashboards, which makes you feel frustrated. We believe everyone should have access to high quality automated dashboards that drive data insights and are available anywhere.
We understand the challenges leaders face transforming how they visualize and use their data. That’s why we created the CDO Advantage where we build you amazing dashboards at an affordable price. Here’s how it works we build you a custom online dashboard in 4 weeks or less. Step 1 you provide us a data, Step 2 we design and deliver dashboards, Step 3 we publish the dashboards and setup automated refreshes. Call us today, so you can stop wasting time asking others for information and start actively monitoring and acting on critical metrics.
Watch our 1 minute Power BI dashboard example and see how you can get business dashboards from almost any data.
CDO Advisors Power BI Consulting Options:
BI as a Service – Low Monthly Fees, Pay Per Month Per User
Executive Dashboards – Get Dashboards in 4 Weeks
Healthcare Dashboard Proof of Concept – SEE your data visualized
Microsoft Power BI Demo – Compare your current reporting to Power BI
Power BI Quick Start Solutions – Ready to start or enhance your Power BI?
Train Your Team – Remote Power BI Developer and End User Training
Use Power BI for Finance Teams – Learn how Power BI can improve operations
Virtual Chief Data Officer – Confused by all your data? We can help
CDO Advisors YouTube – Subscribe and Watch Our YouTube Channel
Get a Free Demo – Healthcare Analytics
Learn More – Power BI Training
Learn More – Power BI Consulting
Learn More – Microsoft Power BI
Read our Healthcare Analytics Blog
