
Visualize Financial Data in a CFO Dashboard with Power BI
Finance leaders require data from across the enterprise in shown in a consolidated CFO dashboard to ensure they can make the best financial decisions for the organization. Having your data stored in disparate enterprise application systems. Presenting a consolidated view of a companies data is more difficult than ever. Creating an executive CFO dashboard with Power BI can quickly pull together data and create a comprehension dashboard. Start with your easily identified data such as Excel files to begin your journey. Then connect Power BI to these files to create CFO dashboards that can be accessed from your PC, tablet or mobile device. Interested in learning more? Ask us about our financial dashboard examples that show you how to take your data and move it to a modern data and analytics solution in the cloud.
Are you frustrated by your current reporting solution? Can you access your metrics and Key Performance Indicators (KPIs) on your table or phone? Does your financial team have self-service and actionable data and reporting? If not, move to a modern dashboard and analytics platform. Convert a CFO dashboard excel format to an interactive data visualization tool that enables better decision making.
According to Deloitte, “By improving visibility into profitability, finance can help drive other enhancements, for example, more effective pricing strategies and identification of opportunities for cost reduction.” Are you currently able to effectively see your data and respond to changes in your business? If not, we work with you to build a CFO Dashboard example using your data so you can see exactly how a dashboard can allow you to gain insights into your operations.
Get a Free CFO Dashboard Consultation
Current CFO Data Challenges
- Getting a daily, weekly or monthly view of data is time consuming and highly manual
- Frustrated by limited ability to monitor and measure business performance
- Consolidated view of CFO KPI Dashboard metrics
- Lack of trend analysis and in depth analytics
- Limited ability to accurately forecast sales or budget
- Access to insight into all aspects of business operations is difficult due to disparate systems
Power BI Financial Dashboard Solutions
We can show you Power BI executive dashboard examples. See what other executives are using to drive improvements in their business. Get automated and mobile Power BI CEO dashboards to complement your CFO dashboard.
Organizations that leverage Power BI to implement executive CFO dashboards can gain the following business insights with online a Power BI Financial Dashboard.
- Access data from across the enterprise to create a on stop shop for dashboards and reports
- Gain deeper insights into your data through drill downs and trend analysis
- Securely create and deploy mobile reporting or tablets or phones
- Dashboards that highlight KPIs and critical data
- Quickly identify the best and worst performing sales, customers or products
- Data integration can be done within Power BI without requiring a data warehouse build
Learn about our CFO Dashboard Sample Quick Starts – CFO Dashboard Examples
Executive CFO Dashboard Components
CFO dashboards with Power BI typically include the following key reporting areas. Automate reporting to improve efficiency and drive data driven decision by using a Power BI financial dashboard.
- Cash Flow
- Orders
- Order to Cash
- Opportunities to Sales
- AR Aging
- Inventory
- CapEX and OpEx
- Profit and Loss
- Operations
- HR
See the Top 5 Reason CFO’s need Power BI
Watch this video for to see how Excel data can be transformed into interactive reports and Power BI sample dashboards examples.
To see an example of how Power BI can visualize data – Power BI Dashboard Sample
Looking for ideas of CFO Sample Dashboard KPIs?
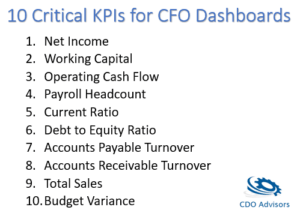
Top 10 CFO Dashboard KPIs
Get better insights and analytics around these common CFO Dashboard metrics:
- Net Income
- Working Capital
- Operating Cash Flow
- Payroll Headcount
- Current Ratio
- Debt to Equity Ratio
- Accounts Payable Turnover
- Accounts Receivable Turnover
- Total Sales
- Budget Variance
Ready to get started on your Dashboard journey? We can show you financial dashboard examples to see the art of what is possible. Have an idea of what you need? We can work with you to build a CFO dashboard example or start with a simple CFO KPI dashboard on your data in as little as 10 days.
Our 3 Step Data Transformation Plan gets you started building Power BI financial dashboards in as little as 10 day – Data Transformation Plan
https://youtu.be/sIDBjtfYIAk
Change your reporting in as little as 8 hours per month with our BI as a Service solution. Low fixed monthly costs that enables data transformation and online dashboards by an expert.
Get a Free CFO Dashboard Consultation
Learn More – Power BI Training
Learn More – Power BI Consulting
Learn More – Microsoft Power BI
Get a Free CFO Dashboard Consultation
Financial Leaders Leverage Power BI for Financial Dashboards
Quickly spot trends and patterns in your data by using Power BI to showcase dashboard metrics that your team needs to easily view and monitor. Combine data from financial performance with operations and sales metrics to create a comprehensive view of organization performance.
Common CFO Dashboard metrics include:
- Debt to Equity Ratio
- Accounts Payable Turnover
- Payroll Headcount
- Payroll Headcount Ratio
- Budget Variance
- Current Ratio
- Operating Cash Flow
- Equity Ratio
- Inventory Turnover
- Profit and Loss
- Net Profit
- Net Profit Margin
- Profit Margin
- Current Liabilities
Ready to move to online financial dashboards from manual financial excel reports? Contact us today for a demo and see what you are missing.
Make better and faster decisions with automated reporting we can let you see financial dashboard examples in 30 minutes. We can help you see what your missing with our CFO dashboard examples. Request a free demo now.
Get a Free CFO Dashboard Consultation
I
CDO Advisors Microsoft Power BI Solutions:
BI as a Service – Low Monthly Fees, Pay Per Month Per User
Executive Dashboards – Get CEO Dashboards in 4 Weeks
Healthcare Dashboard Proof of Concept – SEE your data visualized
Microsoft Power BI Demo – Compare your current reporting to Power BI
Power BI Quick Start Solutions – Ready to start or enhance your Power BI?
Train Your Team – Remote Power BI Developer and End User Training
Use Power BI for Finance Teams – Learn how Power BI can improve operations
Virtual Chief Data Officer – Confused by all your data? We can help
Financial Dashboard Examples
CEO Dashboards can also be built using Power BI. We can enhance your CFO Dashboard solution and extend it to other parts of the business and provide a management dashboard that everyone can leverage for better analytics.
Not sure how to get started with CEO Dashboard solutions? Our quick start solution leverage Excel data or extracts from your current reporting programs. Many clients get started with financial dashboards of Excel data that is available online.
Contact us today to get your Power BI Financial Dashboard in weeks not months.